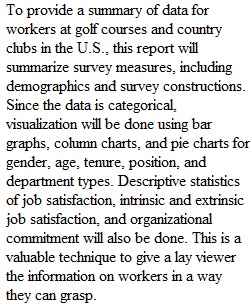


Q Module 1 - SLP DESCRIPTIVE STATISTICS AND VISUAL DISPLAYS Professional Application with Excel **Complete Module 1 SLP before Module 1 Case** Excel is a powerful tool that supports data analysis and provides managers with support for making decisions. Mastering Excel functions is an important step in the process. Session Long Project 1 Resources COUNTIF function Available chart types in Office Load the Analysis ToolPak in Excel (You will need this) Use the Analysis ToolPak to perform complex data analysis (Descriptive Statistics) What is a pie chart? The story you want to tell...and the one your data shows How to Label Figures in APA Format SLP Assignment Data Analysis with Excel Use the Excel Data found in Module 1 Case. Create the following visuals using Excel for the survey Demographics: • Gender- Pie Chart • Age-Pie Chart • Department-Column Chart • Position- Bar Chart • Tenure- Bar Chart Provide a one-sentence description of each visual. How to Label Figures in APA Format SLP 1 Assignment Guidance Files (Part 1) BUS520 SLP 1 Assignment Video Guidance Part 1 BUS520 SLP 1 Assignment Guide Part 1 Run “Descriptives” for each of the four Survey Measures: • Job Satisfaction • Intrinsic Job Satisfaction • Extrinsic Job Satisfaction • Organizational Commitment Research the four survey measures and provide definitions (1-2 sentences each). Select the best “descriptives” for each survey measure and analyze them. (2 minimum per measure, for a total of 8) Explain why the measures were chosen. (Research support required) SLP 1 Assignment Guidance Files (Part 2) BUS520 SLP 1 Assignment Video Guidance Part 2 BUS520 SLP 1 Assignment Guide Part 2 No quotations are permitted in this paper. Since you are engaging in research, be sure to cite and reference the sources in APA format. NOTE: failure to use research with accompanying citations to support content will result in reduced scoring “Level 2-Developing” across the grading rubric. This is a professional paper; not a personal one based on feelings. It must be written in the third person; this means words like “I”, “we”, and “you” are not appropriate. SLP Assignment Expectations Use the attached APA-formatted template (BUS520 SLP1) to create your submission. • The template is set up in APA 7: double-spacing, font, margins, headings, page breaks, APA help links. Your submission will include: • Trident University International’s cover page • A paper with APA citations (2- to 3-sentence introduction, body (includes Excel output), 2- to 3-sentence conclusion) • The reference list page in APA format • Excel Spreadsheet. Grade will not be posted without Excel upload.
View Related Questions